Billionaires Analysis with Python
Analyzing billionaires and their wealth has always been an intriguing topic, shedding light on the dynamics of wealth accumulation and distribution. With the availability of vast datasets and powerful data analysis tools like Python, we can delve into the world of billionaires and gain insights into their profiles, trends, and wealth patterns. In this article, we will explore how to perform billionaire analysis using Python.
Python offers a rich ecosystem of libraries and frameworks that enable us to collect, process, and analyze large datasets efficiently. By leveraging Python's data manipulation and visualization libraries, we can uncover fascinating information about the world's billionaires and their fortunes.
In this article, we will start by sourcing billionaire data from various reputable sources, such as financial publications or publicly available datasets. We will then use Python libraries such as Pandas for data manipulation, NumPy for numerical operations, and Matplotlib or Seaborn for data visualization.
We can analyze various aspects of billionaire wealth, such as their geographical distribution, industries in which they accumulated their fortunes, trends in wealth accumulation over time, and the factors that contribute to their success. Python's powerful statistical analysis capabilities, along with machine learning libraries like scikit-learn, can be employed to uncover correlations and patterns within the billionaire dataset.
Furthermore, we can use Python to create interactive visualizations and dashboards, allowing us to present our findings in an engaging and informative manner. These visualizations can help us highlight key insights, such as the most influential billionaires, wealth disparities, or the impact of external factors on billionaire wealth.
By combining Python's versatility, data analysis capabilities, and visualization tools, we can gain a deeper understanding of the billionaire landscape and derive meaningful insights from the data. Whether you're interested in studying wealth inequality, entrepreneurial success, or the global distribution of billionaires, Python provides the tools to explore and analyze this fascinating domain.
Are you ready to embark on a journey into the world of billionaires and their wealth using Python? Let's dive in and uncover the stories behind the billions through data analysis and visualization.

1- I will start this task by importing the necessary Python libraries and the dataset:
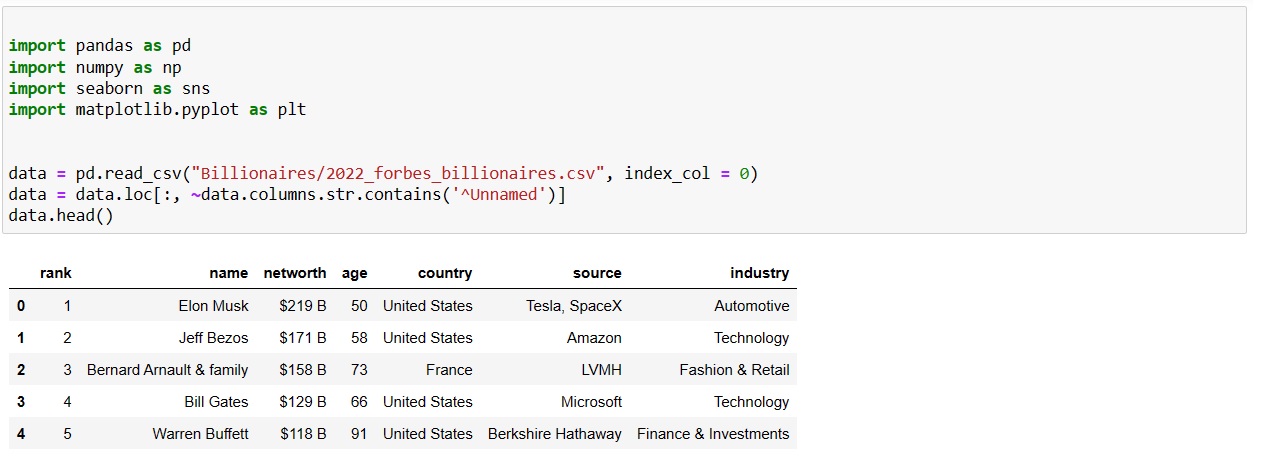
2- Let's explore our dataset:
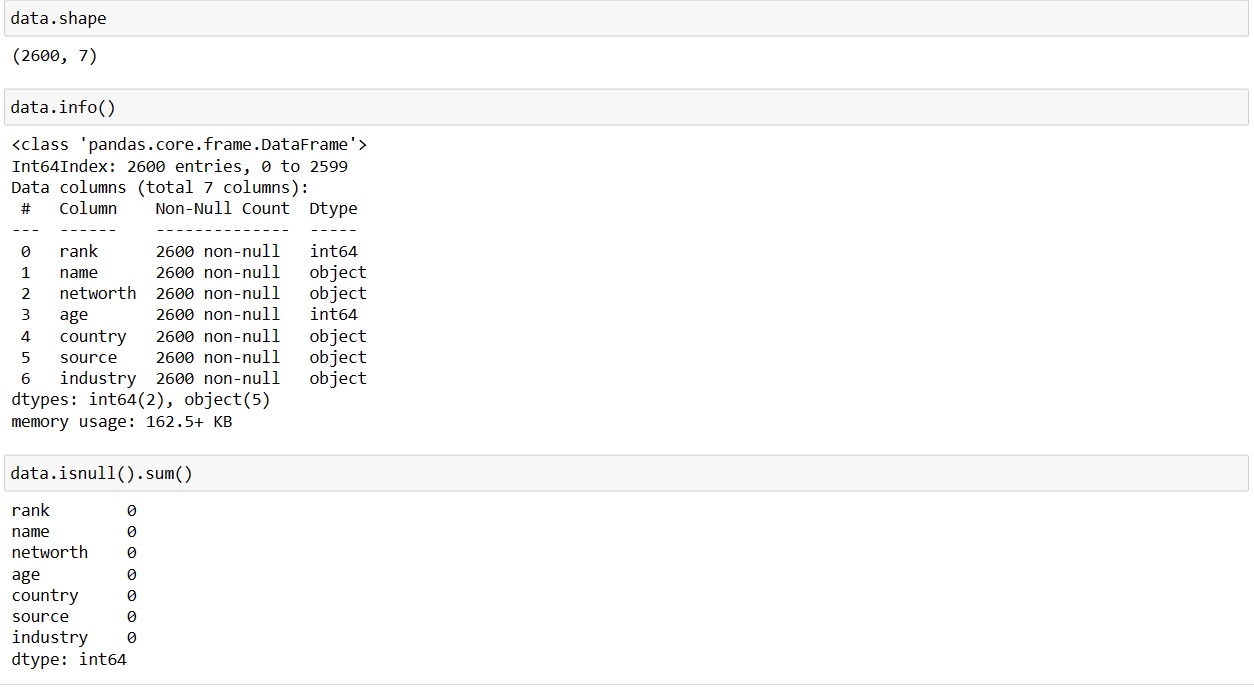
This dataset does not contain any missing values
The 'networth' column in this dataset has a $ sign at the beginning of Billionaires’ Net worth and B at the end. So we need to remove these signs and convert the NetWorth column to float:

Let's see the top 10 billionaires by net worth:
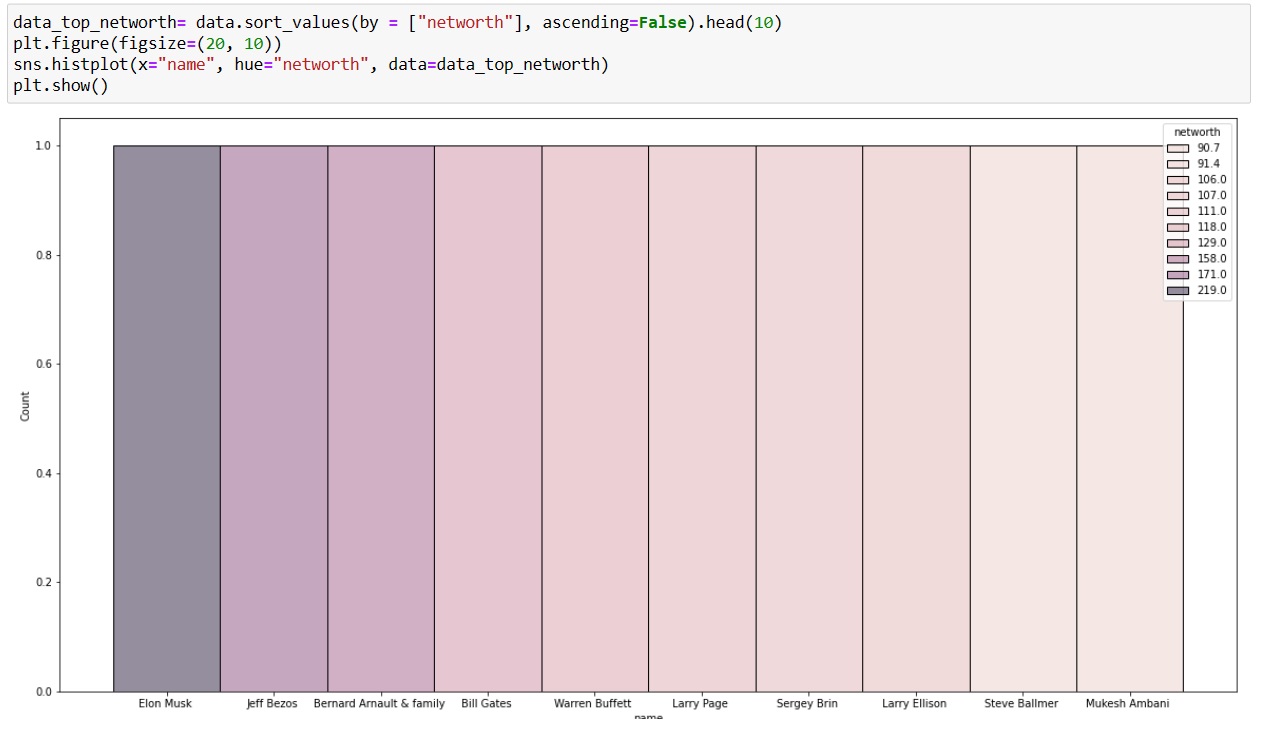
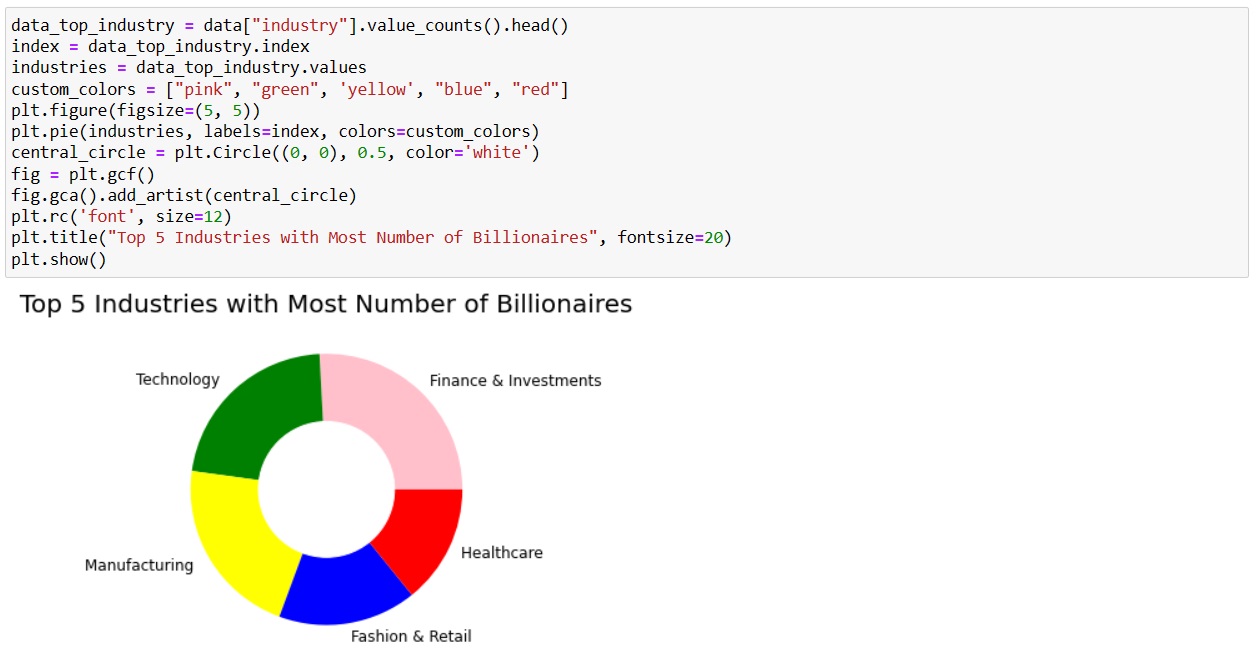
As well as the top 5 areas with the most billionaires:
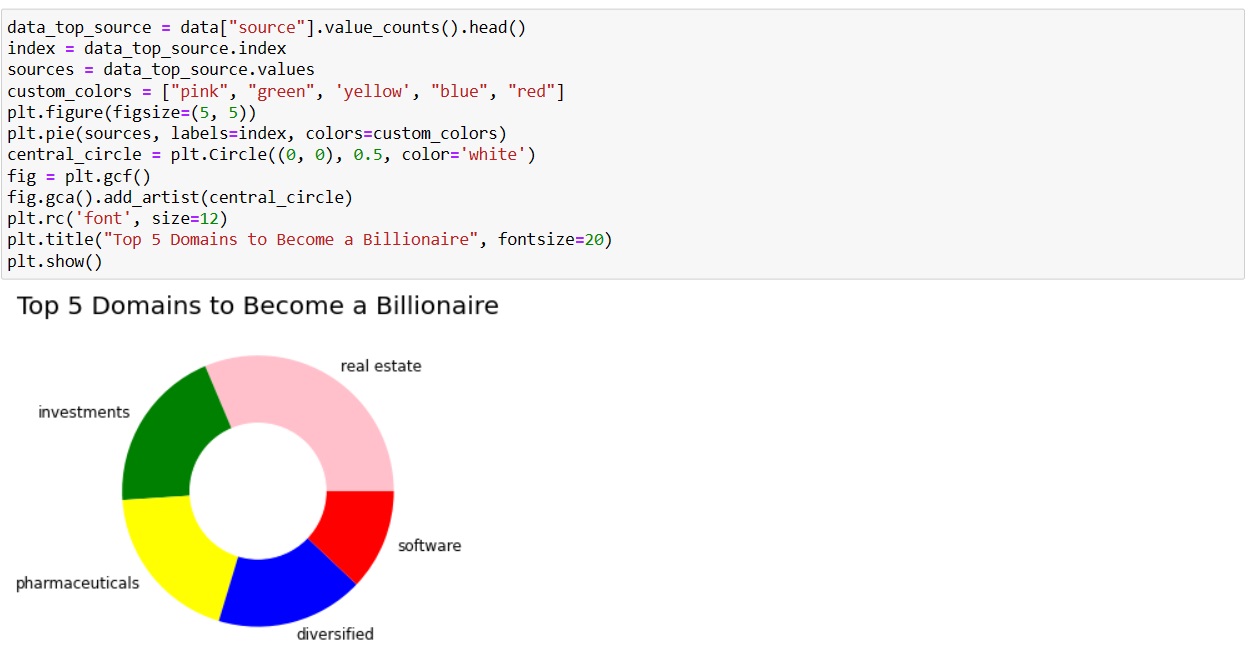
The top 5 areas with the most billionaires:
The top 5 countries with the most billionaires:
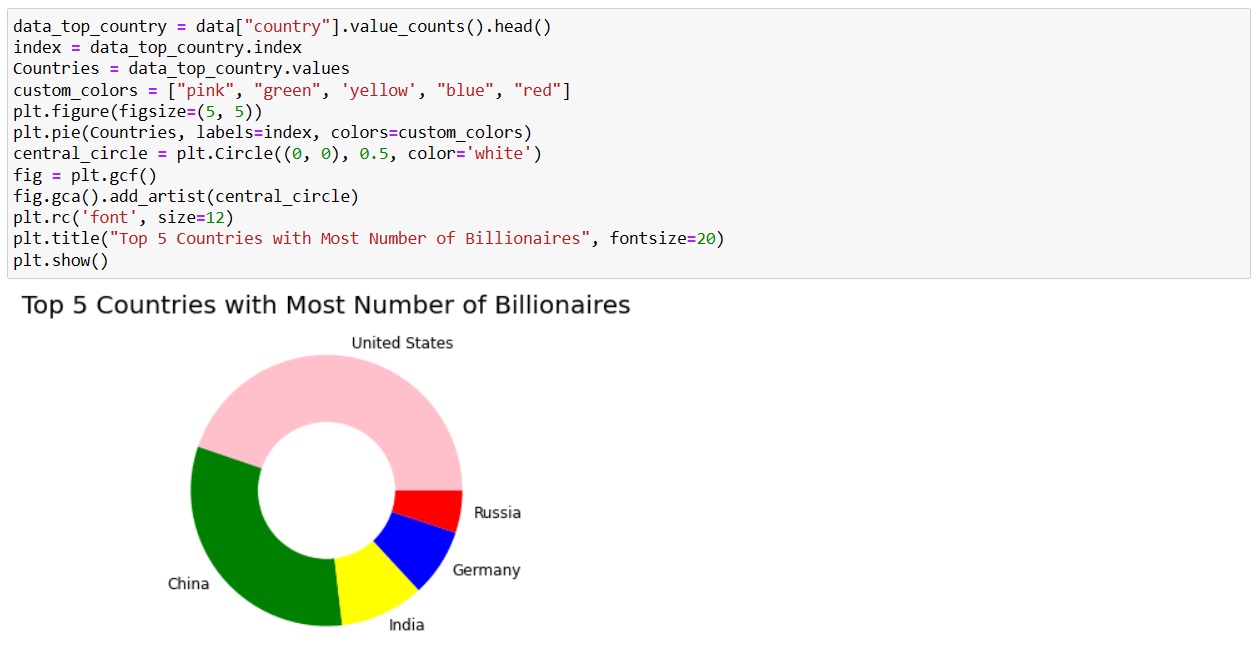
China and the United States are the countries with the most billionaires, which concludes that the business environment and success rate of a startup are much better in the United States and China than in the rest of the world.